Francis-99
Test case - Turbine
Test case - Turbine
Test facility
A model Francis (known as Francis-99) turbine available at the Waterpower Laboratory, NTNU, was used for the measurements. Figure 1 shows the hydraulic loop of the test rig. Water from the basement reservoir (9) was pumped to the overhead tank (2) and flowed down to the turbine (7). A feed pump (1) was operated at a selected speed to maintain constant head. The draft tube outlet was connected to a downstream vessel (8), where a constant head was maintained at an atmospheric pressure and the water above the runner centerline was returned to the basement (9). The test rig is capable of producing head up to 16 m for the open-loop and up to 100 m (flow rate ≤ 0.5 m3 s-1) for the closed loop.
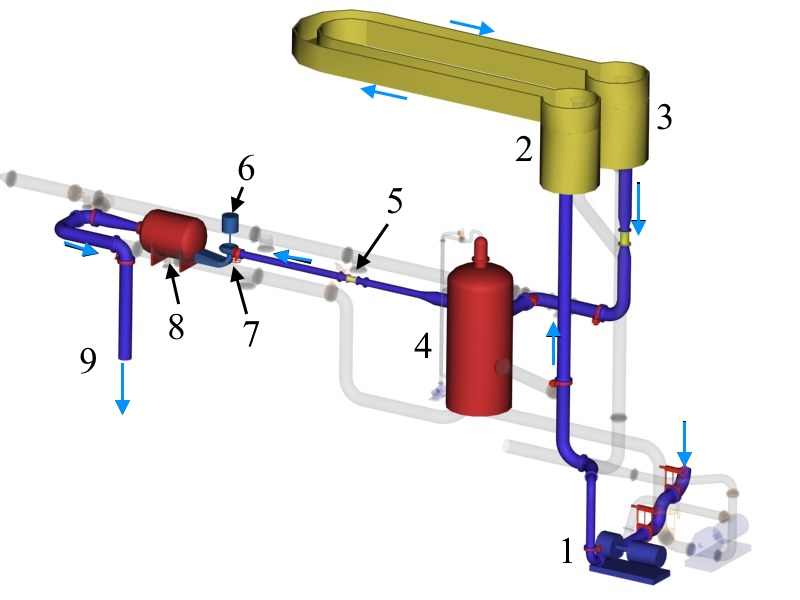
The Francis-99 turbine is a reduced scale (1:5.1) model of a prototype operating at the Tokke power plant, Norway. The turbine includes 14 stay vanes integrated inside the spiral casing, 28 guide vanes, a runner with 15 blades and 15 splitters, and an elbow-type draft tube. The runner includes an alternating arrangement of a splitter and a blade. The runner inlet and outlet diameters are 0.63 m and 0.347 m, respectively. The runner is directly coupled to a DC generator, which also operates as a motor in pumping mode. The test facility is often used for the industrial model test according to IEC 60193 in a closed loop (30 m head, Re = 4 ✕ 106), and it is equipped with standard instruments used to measure the head, flow rate, torque, water temperature and rotational speed.
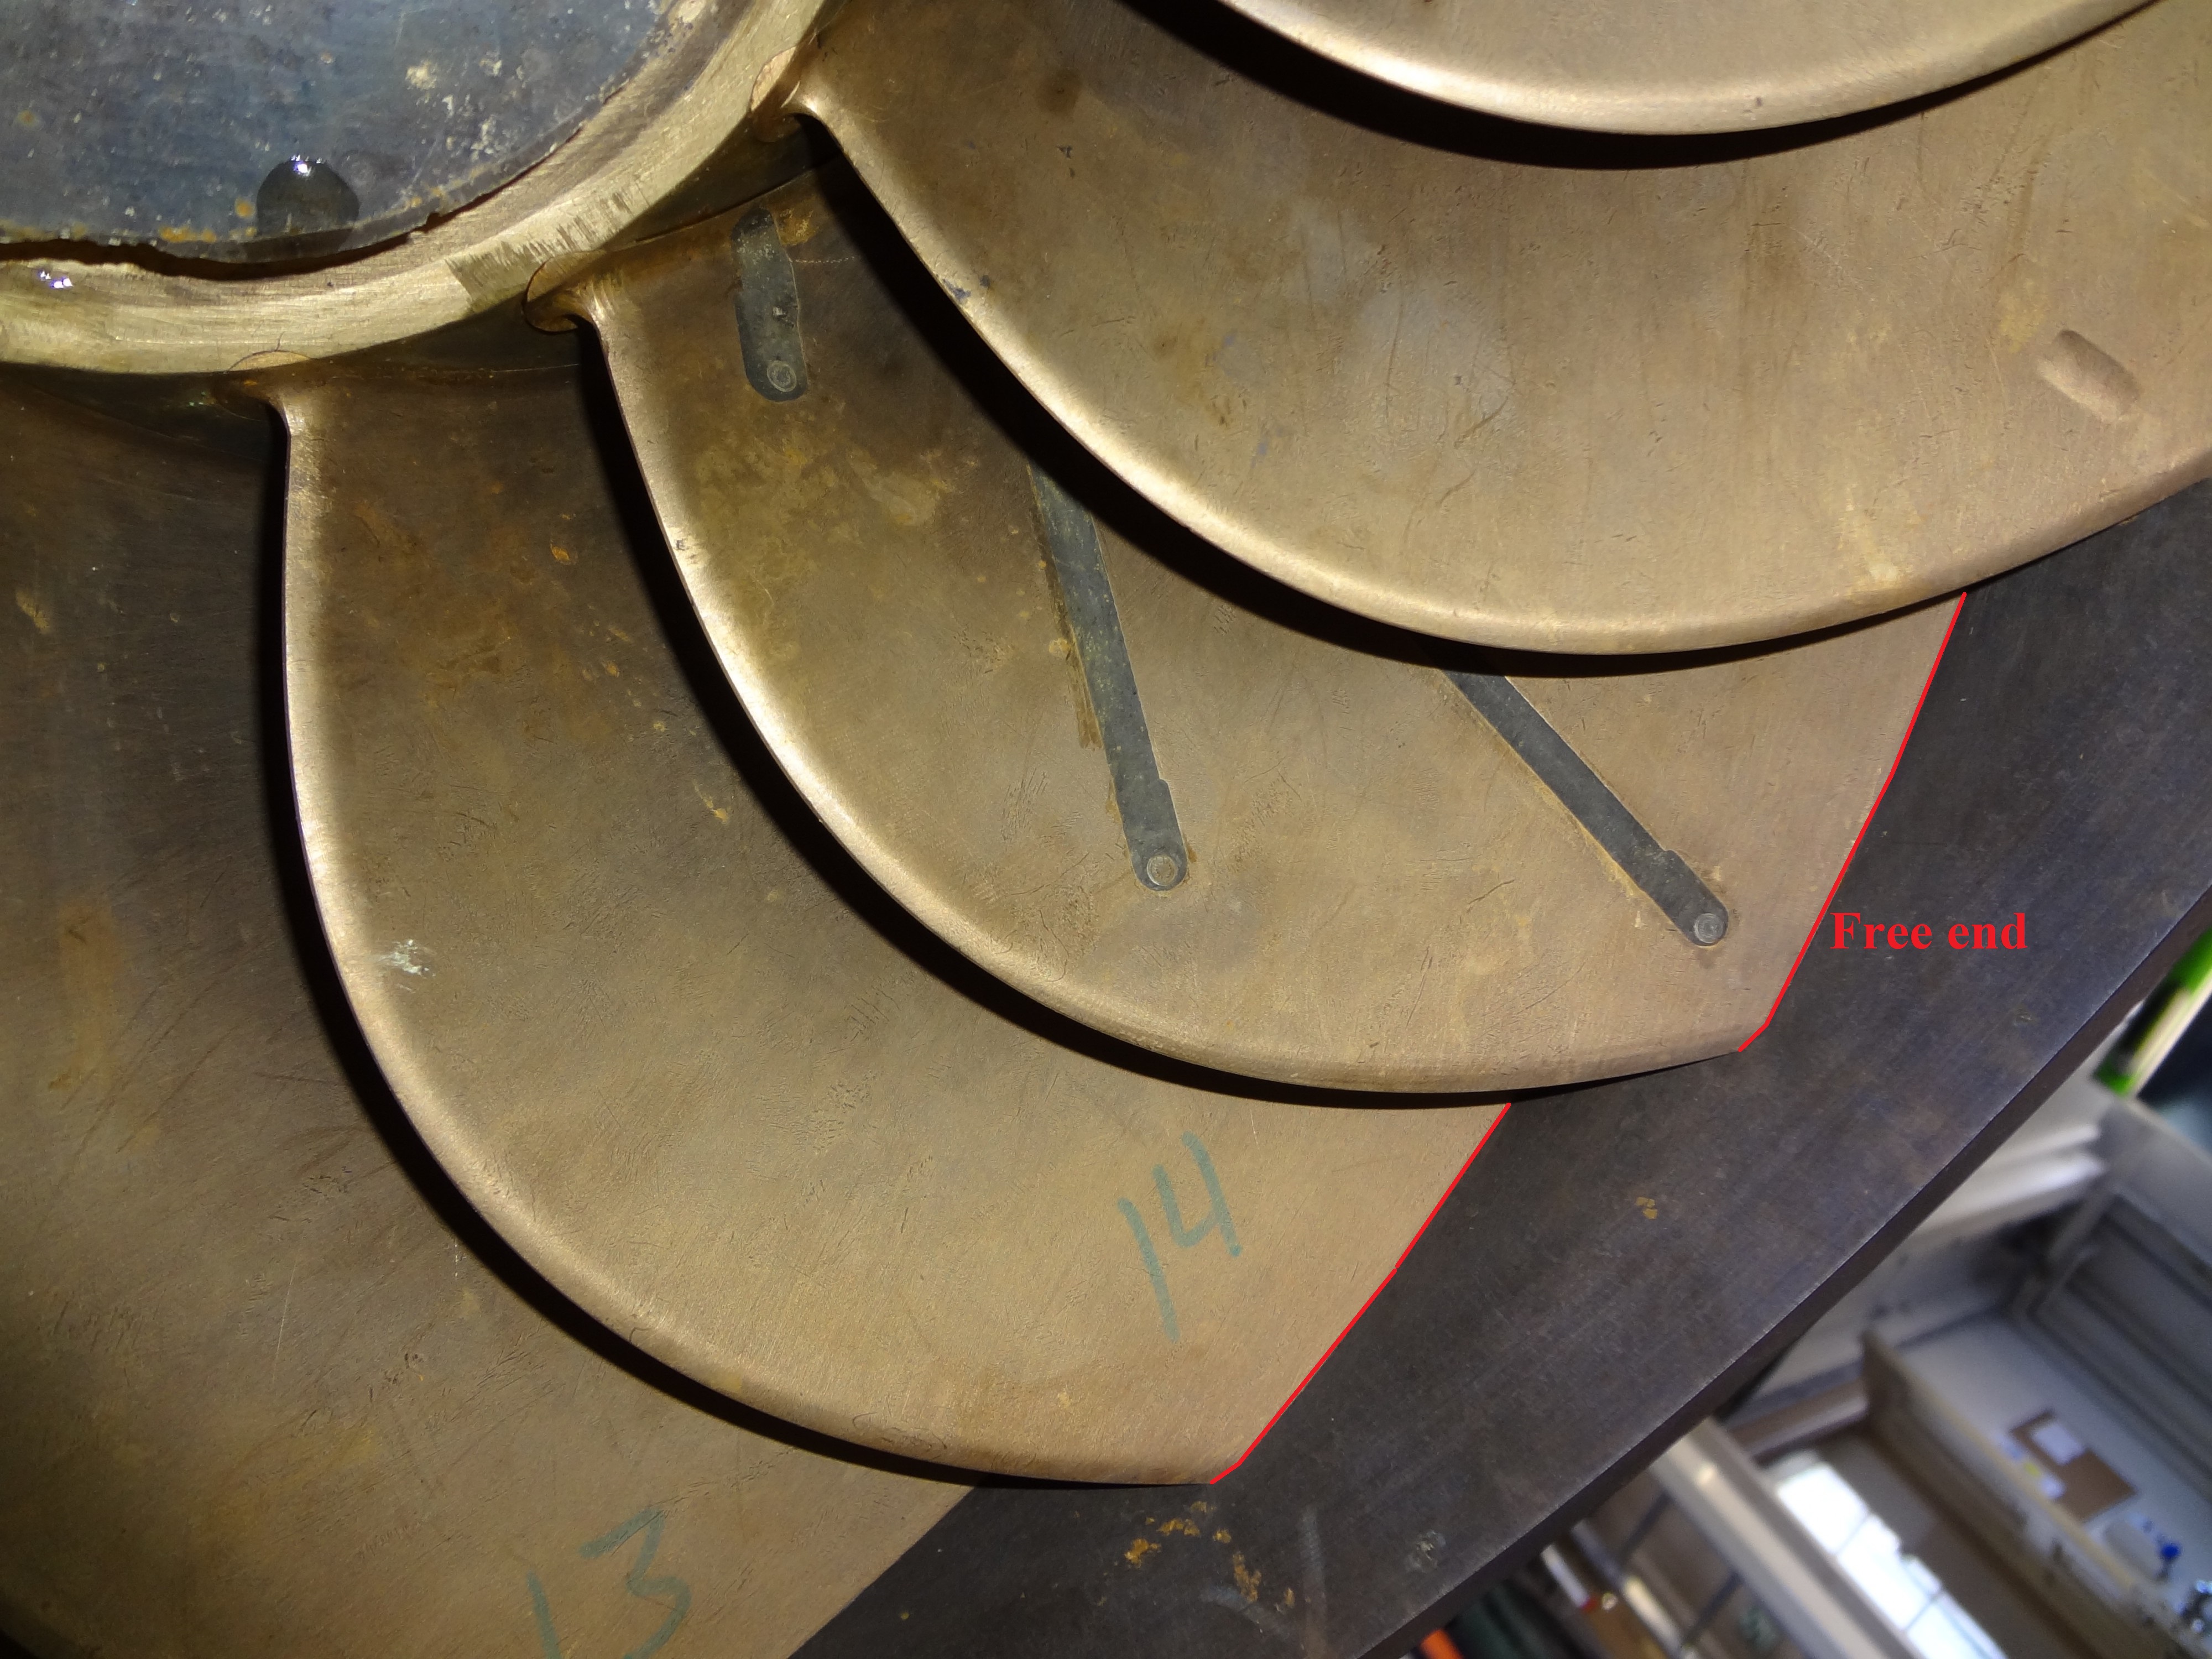
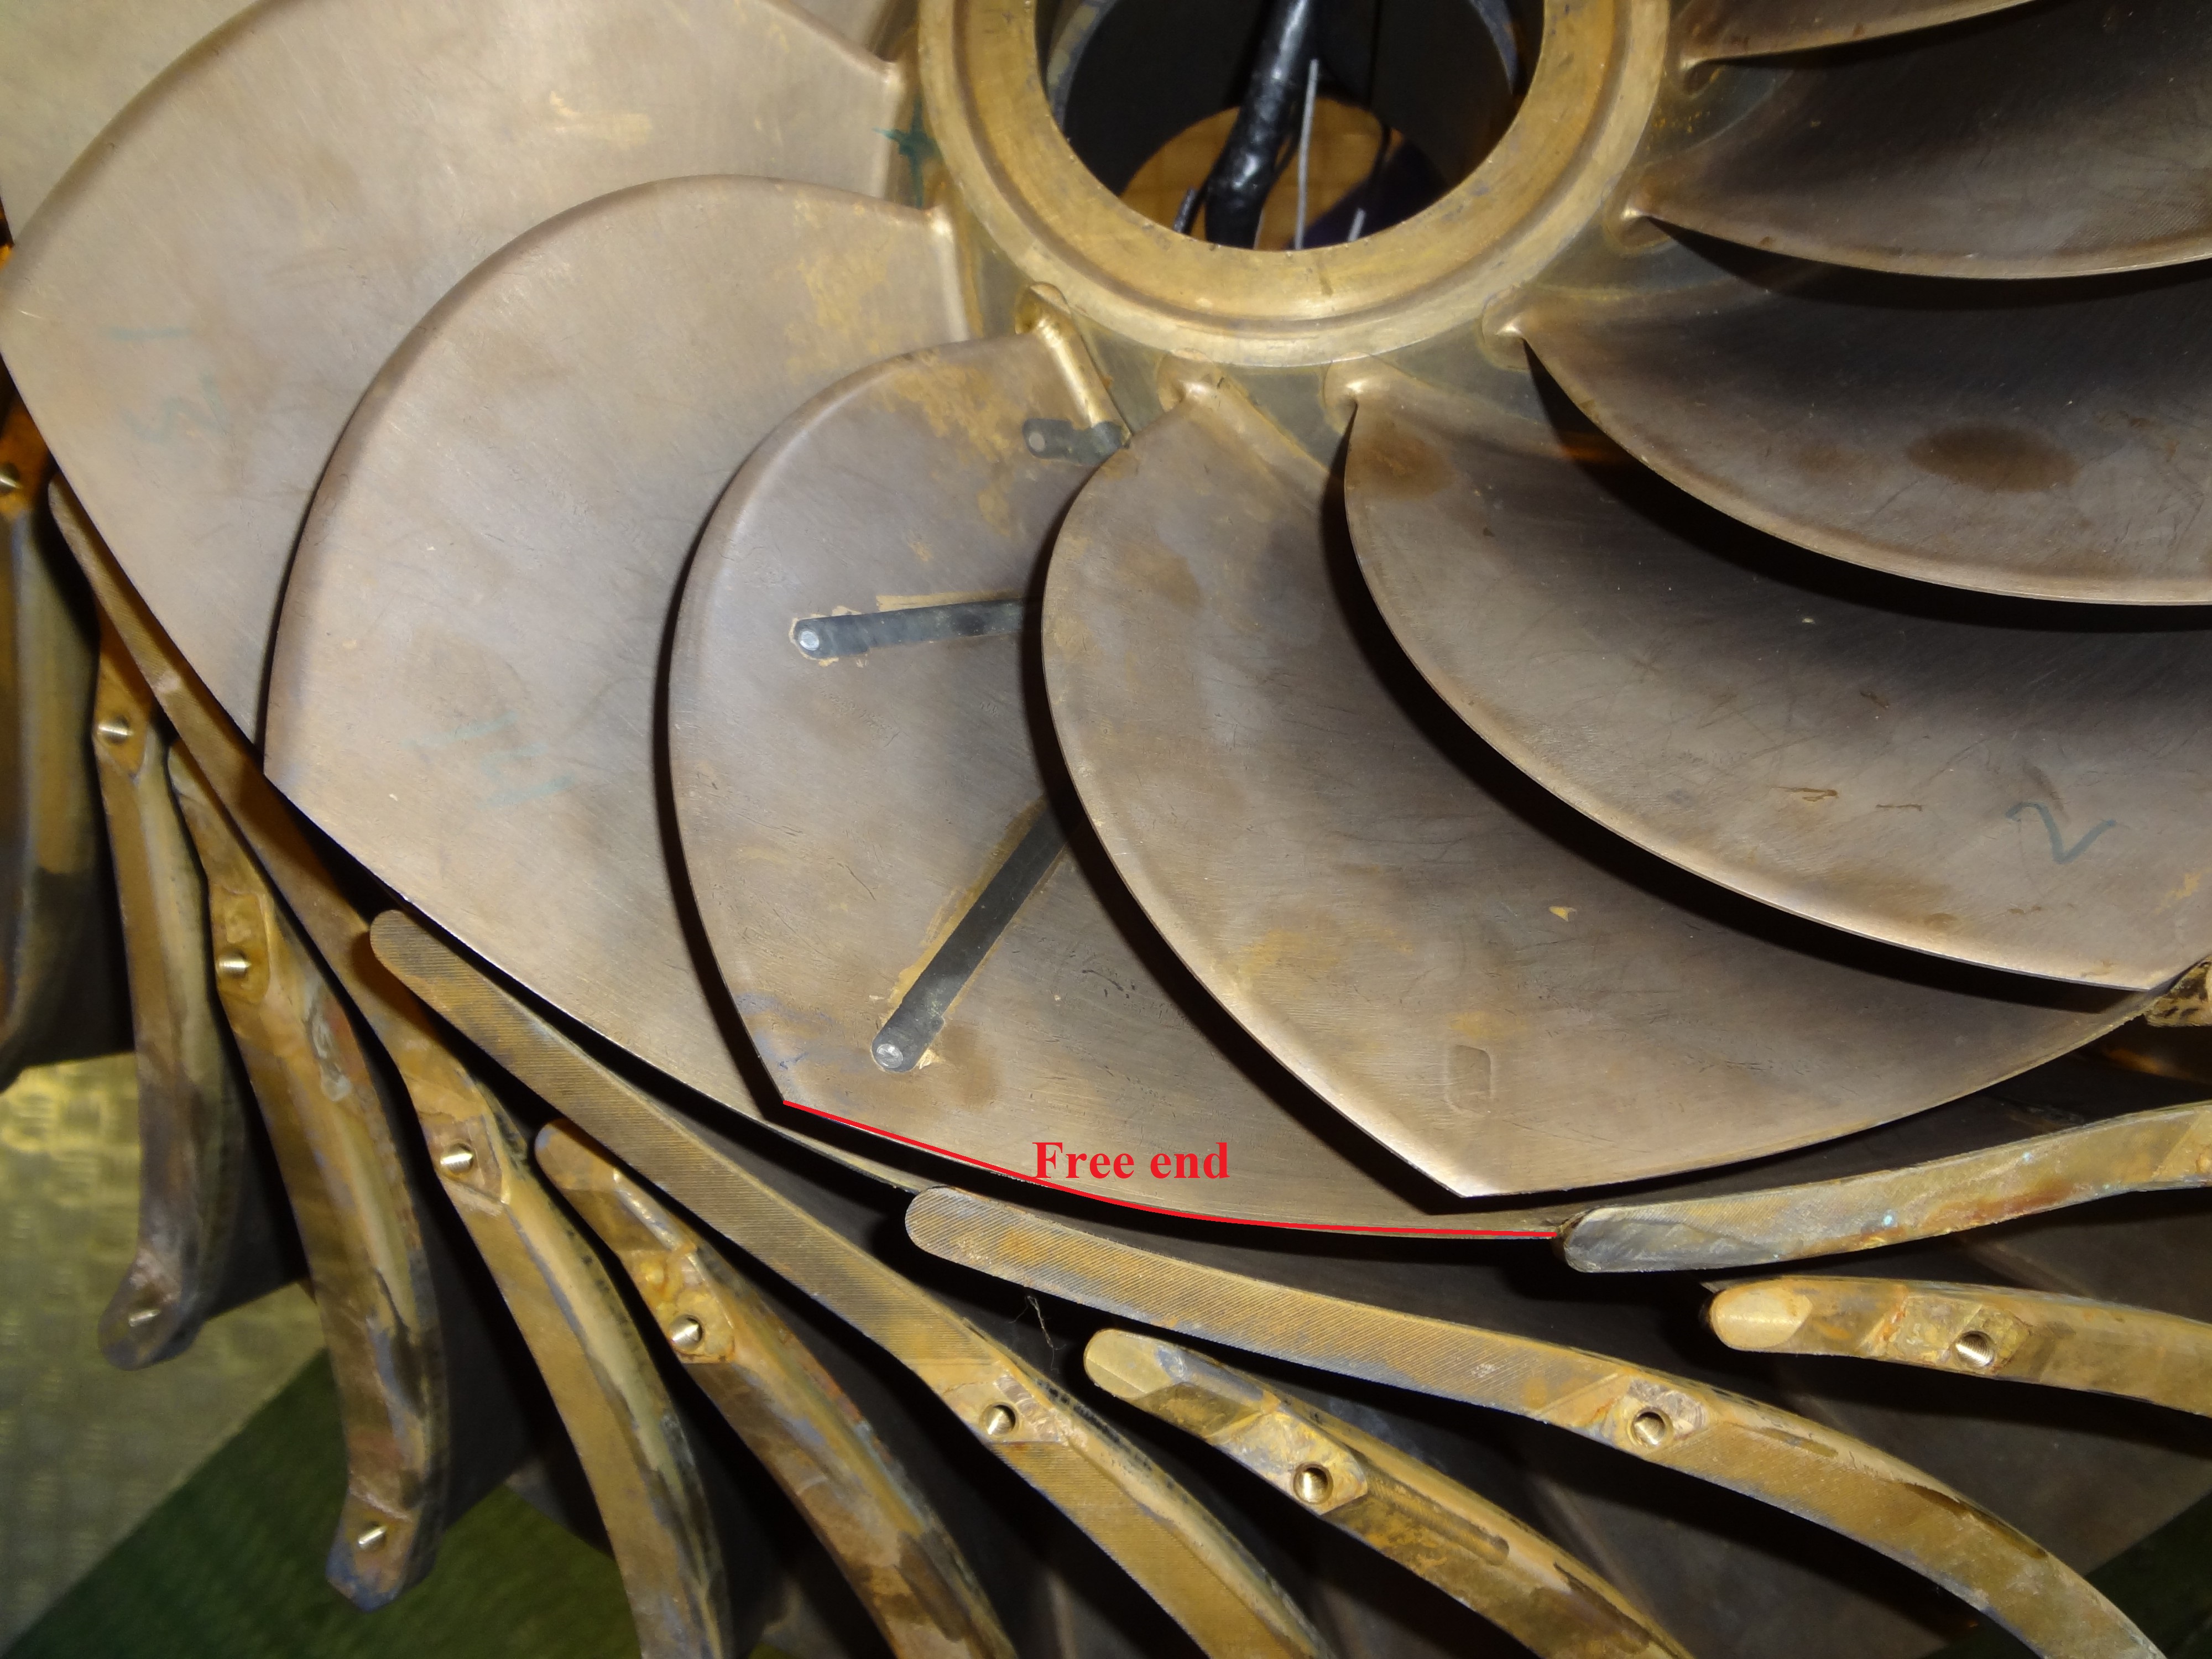
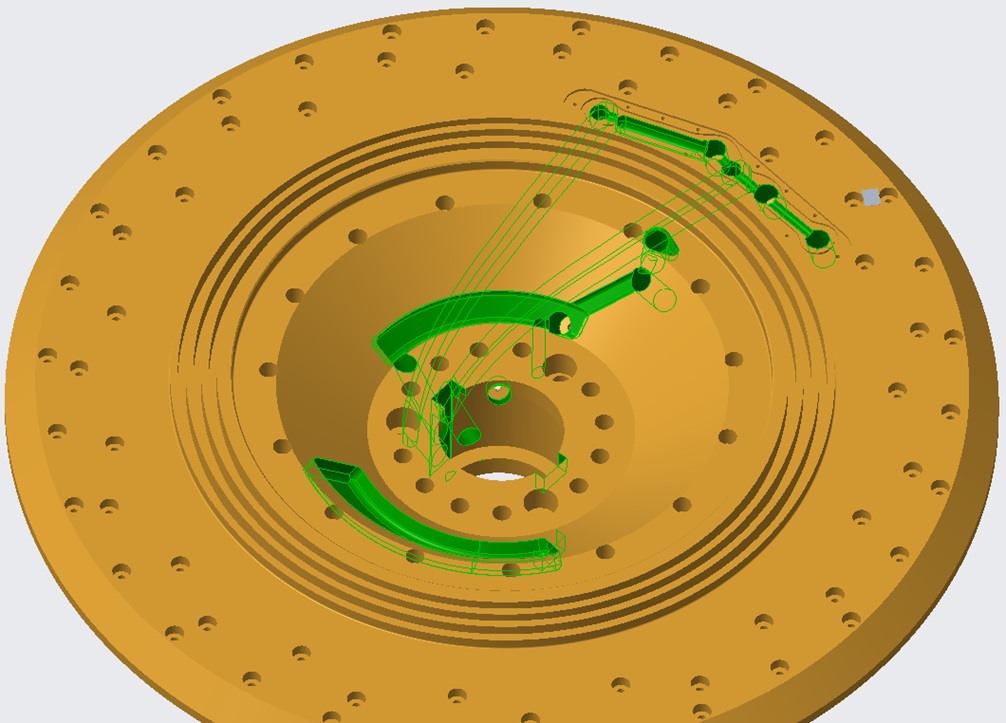
One of the concerns measuring blade loading on the Francis-99 runner is the complex assembly. The runner blades are joined to the crown and band with bolts, which means there is a possibility for rotational asymmetry related to the blade mounting. In addition, the blades at the trailing edge joined to the band are free (around 94 mm length). This is marked in Figures 2 and 3. In this area, variation in gap between the blades and the band is observed. By exciting the blades with the impact hammer, it was clear from the sound response that the blades have different preloading (possibly pretension). A second concern is the crown with several holes and cable channels as shown in Figure 4. The holes were created to perform pressure measurements in the runner. It is fact that this will create asymmetrical stiffness, meaning the bending stiffness of the crown is dependent on the bending direction. Hence, there is possibility of high uncertainty in the strain measurements at these locations. Considering these concerns, the turbine test case is limited for specific study of FSI based on pressure measurements only. This time, we provide data of pressure amplitudes pertained to rotor-stator interaction frequencies and the harmonics. The data may be used to prescribe pressure loading on the blades or blade loading of specific frequency, i.e., RSI, and conduct stuctural analysis.
Data
Measurements and data
Figure 5 shows locations of pressure sensors in the runner. The guide vane passing frequency fgv and the harmonic are determined at the sensor locations. The sensor coordinates are shown in Table 1, which are identical to the runner geometry provided for the FSI analysis. Measurements are conducted at five different operating points, keeping same opening angle of the guide vanes; however, the rotational speed of the runner and the head values are different, which are presented in Table 2. From these measurements, we found that the amplitudes of RSI frequency varied significantly and at certain operating condition, the amplitudes are relatively high. This may be the indication of resonance in the turbine at that operating condition. This could be interesting to investigate numerically.

| Sensor name | x (mm) | y (mm) | z (mm) | Type | Mount |
|---|---|---|---|---|---|
| R1 | 180.50 | 158.81 | 21.73 | Entran 7bar | Flush |
| R2 | 84.30 | 132.85 | -9.50 | Entran 7bar | Flush |
| R3 | 25.75 | 118.88 | -31.61 | TE XP5 | Flush |
| R4 | -17.40 | 85.19 | -59.59 | TE XP5 | Flush |
| Description | Flow rate (m3 s-1) | nED | QED | Head (m) | α (degree) | Speed (rpm) |
|---|---|---|---|---|---|---|
| BEP-1 | 0.134 | 0.179 | 0.154 | 5.2 | 10 | 219.8 |
| BEP-2 | 0.160 | 0.176 | 0.156 | 7.2 | 10 | 254.3 |
| BEP-3 | 0.183 | 0.178 | 0.154 | 9.6 | 10 | 297.8 |
| BEP-4 | 0.209 | 0.178 | 0.155 | 12.6 | 10 | 340.5 |
| BEP-5 | 0.232 | 0.180 | 0.154 | 15.55 | 10 | 381.7 |
The pressure sensors were initially calibrated statically with the use of dead weight tester as primary reference. All components in the pressure measurement chain, from the sensors to the data acquisition in current setup are stated to have resonance frequencies above 10 kHz, hence it is assumed that the dynamic uncertainty is very low and only repeatability and hysteresis remains in the uncertainty due to covariance. A repeatability test was conducted at 1 Hz with a pressure alternating between 100 kPa and 90 kPa absolute pressure. Uncertainty budget for the RSI amplitudes is presented in Table 3. A vibration test with the runner in air was conducted to analyze the pressure sensors vibration sensitivity. The results did not give any additional uncertainty.
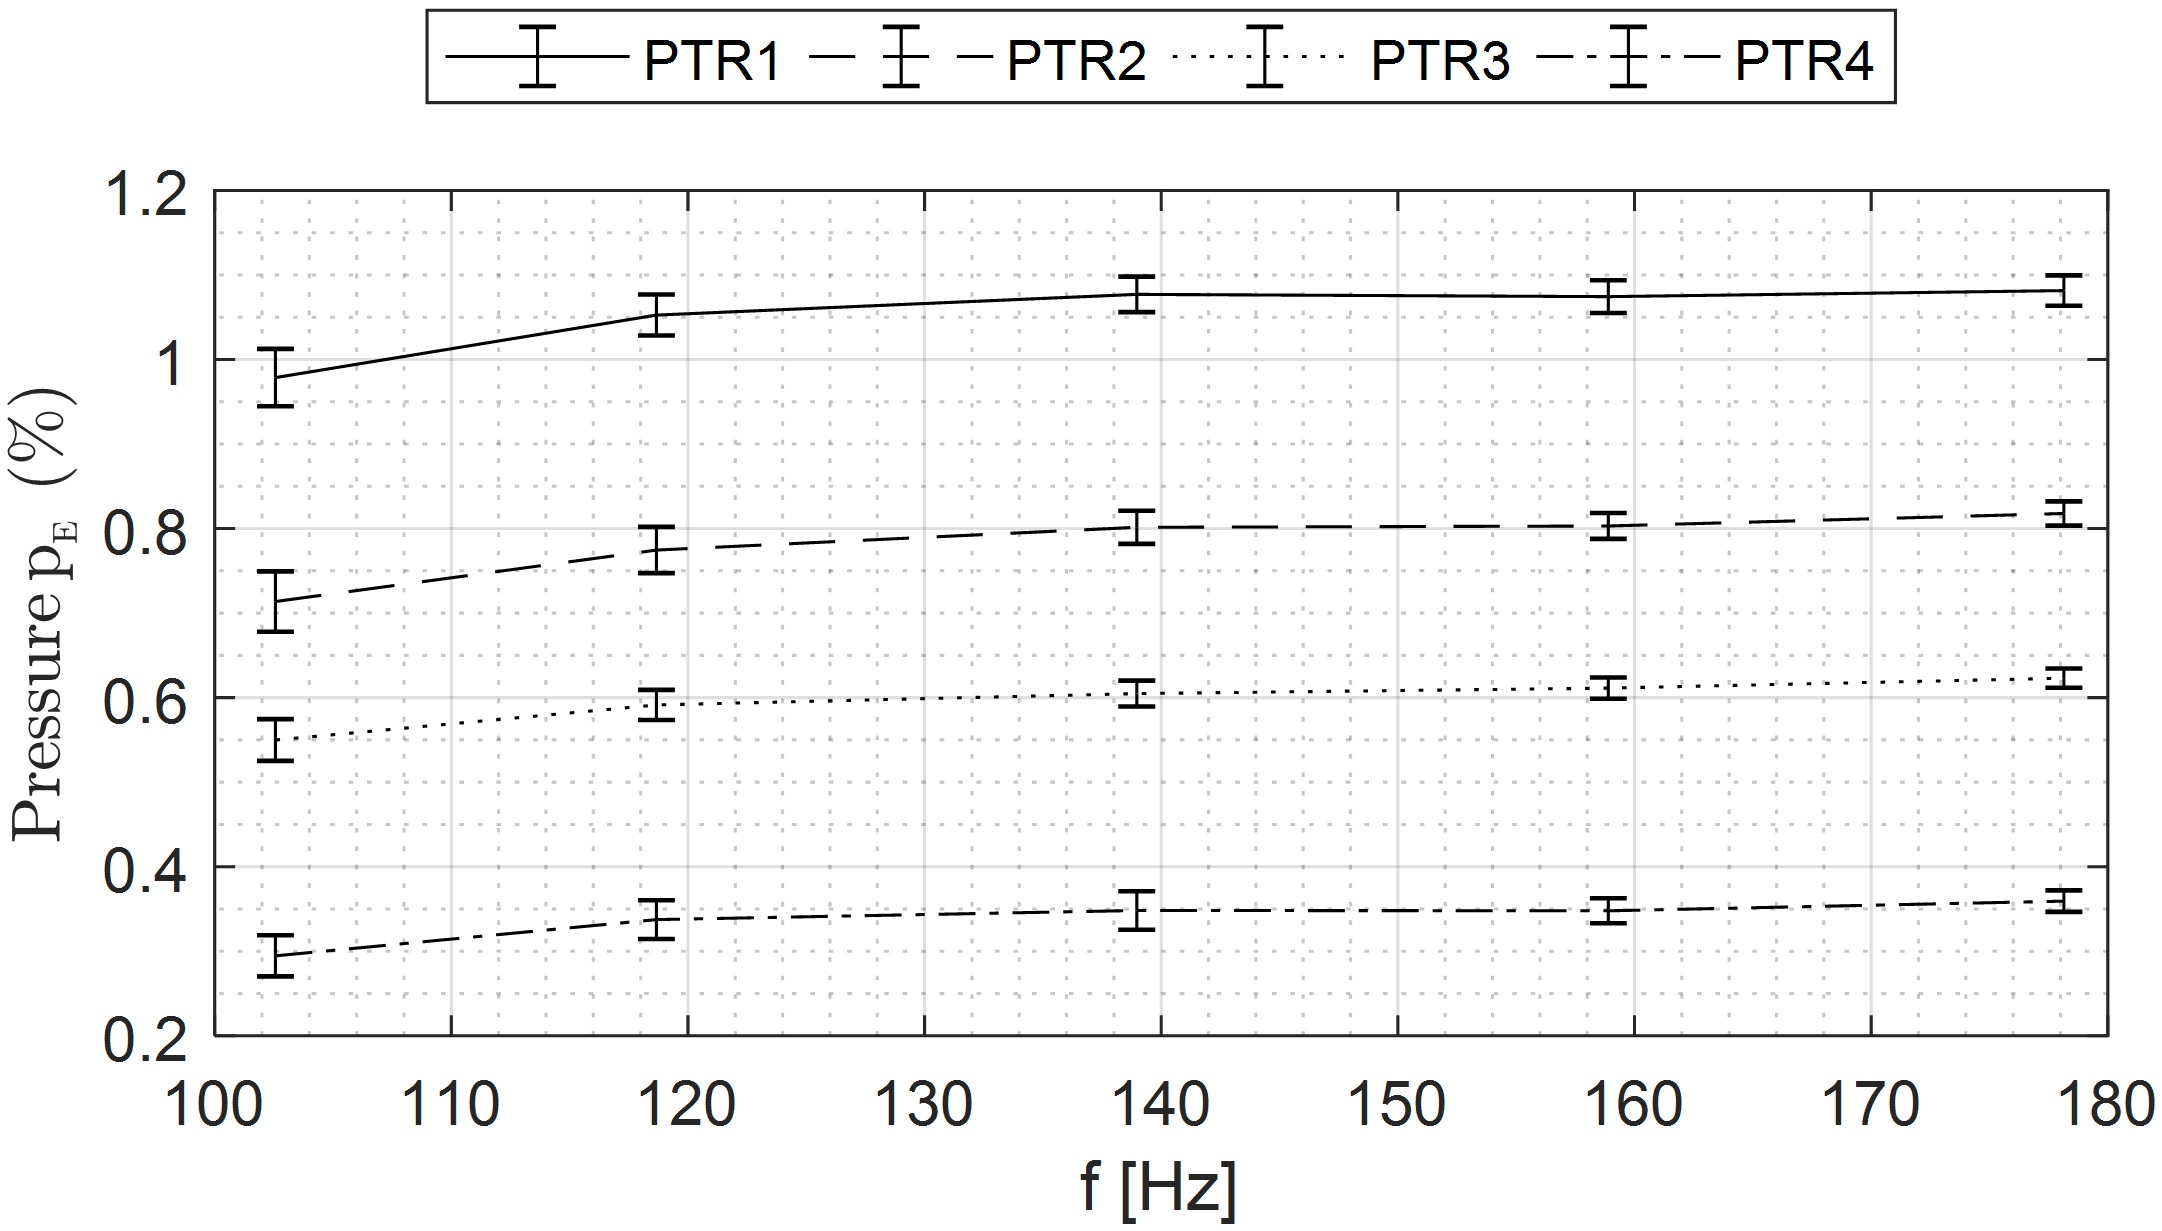
The RSI amplitudes are normalized for head at that operating point. The uncertainty includes the 95% measurement uncertainty and 95% probability of the amplitude variation found from with the use of short time fast Fourier transform. The analysis was performed with window length equal to 100 periods of the RSI signal and with 50% overlap.
| Location | BEP-1 | BEP-2 | BEP-3 | BEP-4 | BEP-5 | |
|---|---|---|---|---|---|---|
| R1 | 0.979 ±0.034 | 1.053 ±0.024 | 1.077 ±0.021 | 1.074 ±0.019 | 1.082 ±0.018 | |
| R2 | 0.714 ±0.036 | 0.775 ±0.027 | 0.802 ±0.020 | 0.803 ±0.015 | 0.818 ±0.014 | |
| R3 | 0.550 ±0.025 | 0.591 ±0.018 | 0.605 ±0.015 | 0.611 ±0.013 | 0.623 ±0.011 | |
| R4 | 0.295 ±0.024 | 0.337 ±0.023 | 0.348 ±0.023 | 0.348 ±0.015 | 0.359 ±0.013 |
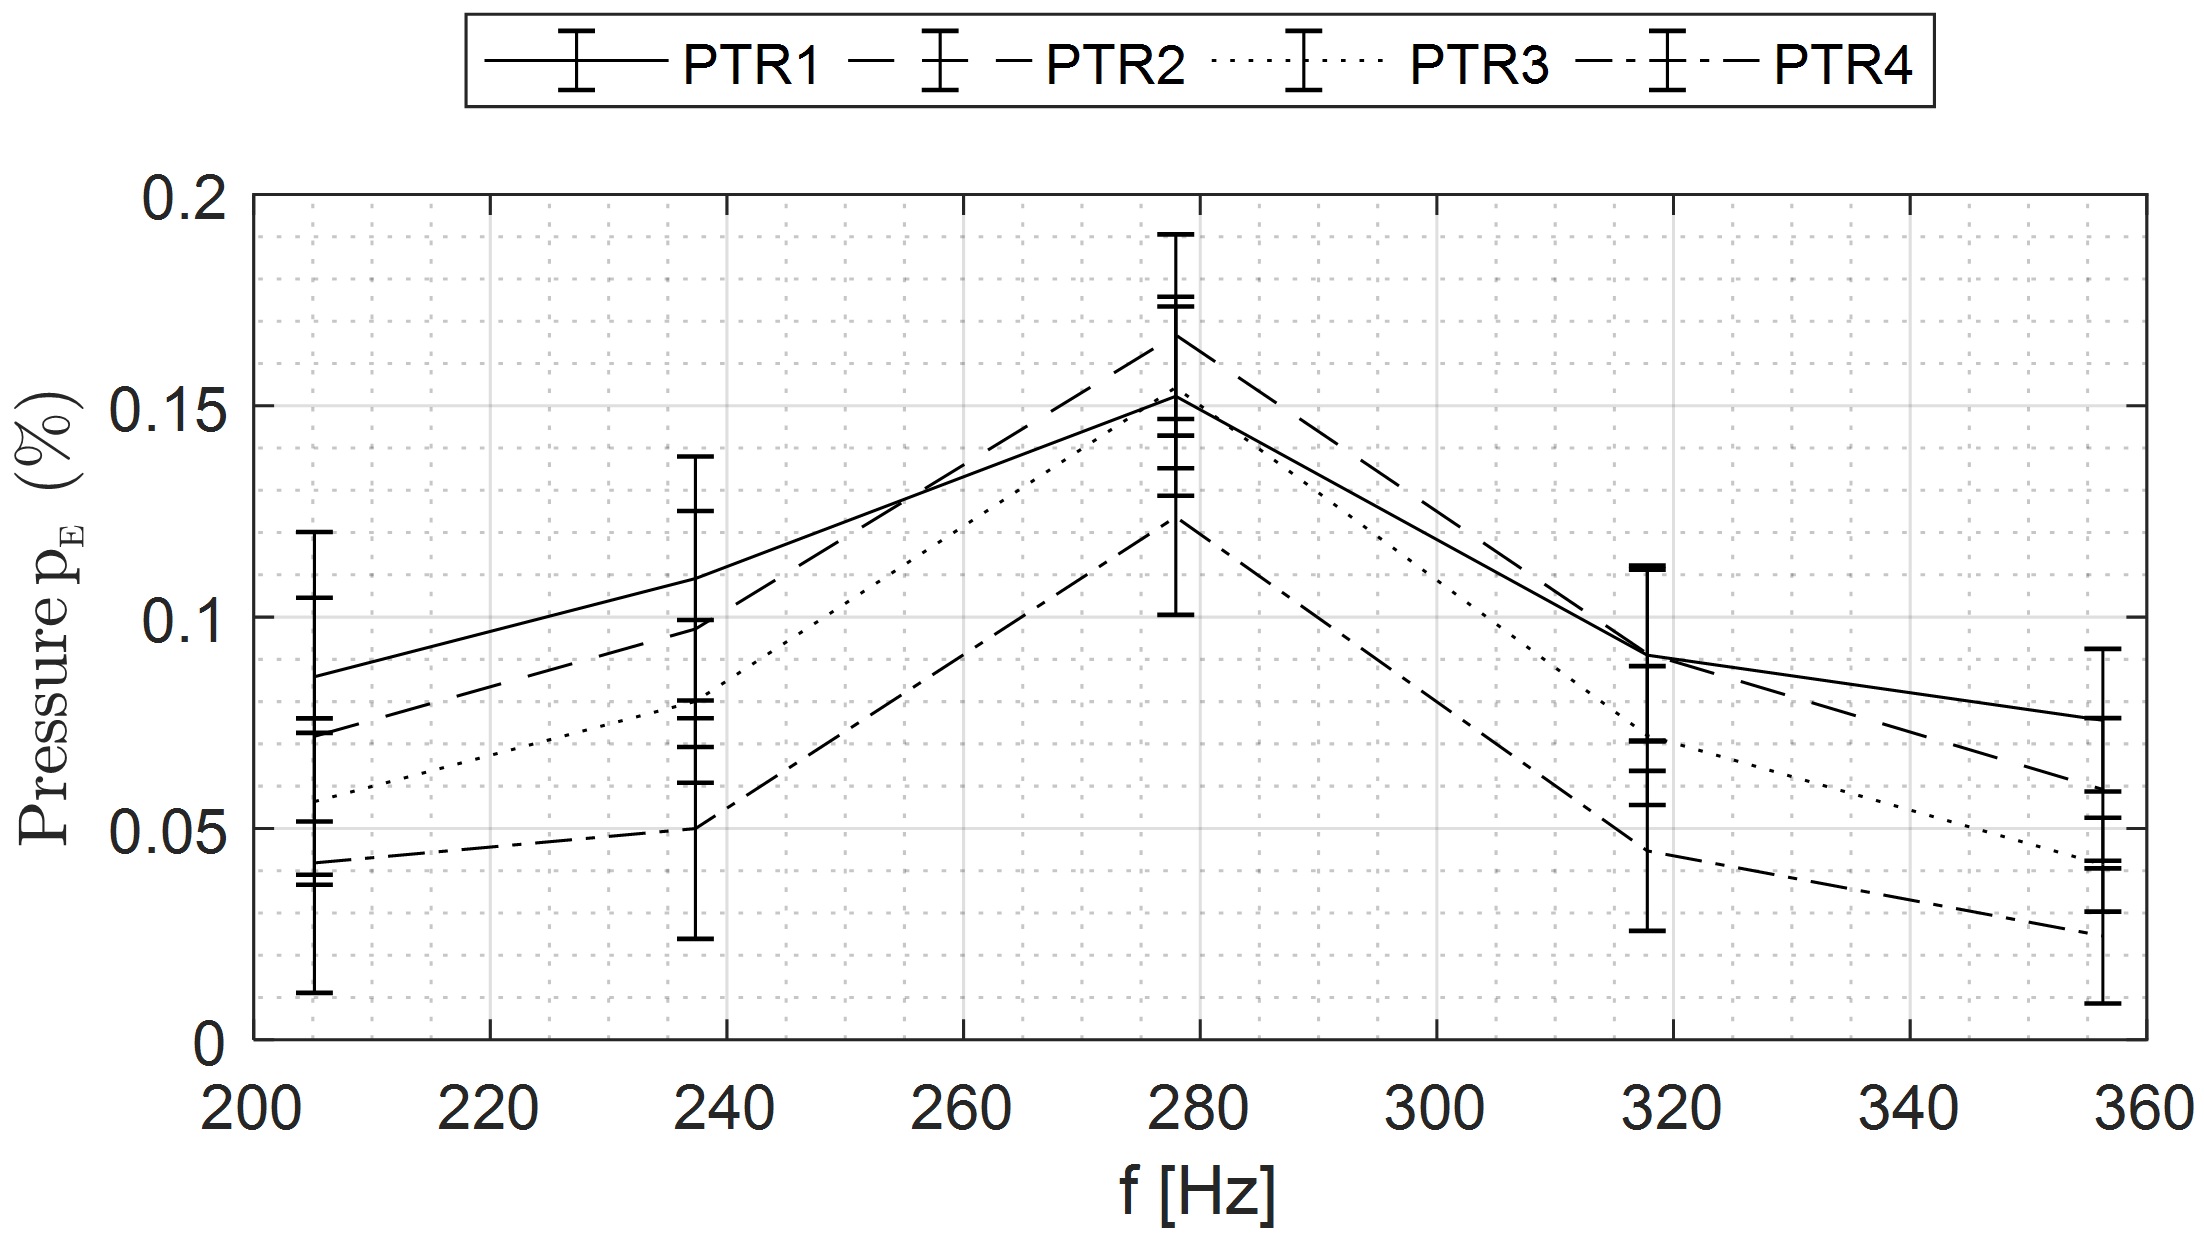
The second harmonic of the guide vane passing frequency had an increasing trend towards the measurement at 280 Hz as shown in Figure 7. This indicates a resonance situation with ND4. The objective of third workshop is to perform FSI simulation to analyze the pressure in the runner channel during the resonance. Only one CFD analysis may be enough to find the excitation pressure. To avoid CFD analysis, other excitation methods could be used to excite the runner with a ND4 pressure field. The objective is not to find the same resonance frequency due to the uncertainties of the assembly of the model runner. However, one can replicate the shape presented in Figure 7 using FSI analysis; amplitudes are not necessary to match exactly with the experimental data.
| Location | BEP-1 | BEP-2 | BEP-3 | BEP-4 | BEP-5 |
|---|---|---|---|---|---|
| R1 | 0.086 ±0.034 | 0.109 ±0.029 | 0.152 ±0.024 | 0.091 ±0.020 | 0.076 ±0.017 |
| R2 | 0.072 ±0.033 | 0.097 ±0.028 | 0.167 ±0.024 | 0.091 ±0.021 | 0.059 ±0.017 |
| R3 | 0.056 ±0.020 | 0.080 ±0.019 | 0.154 ±0.019 | 0.072 ±0.016 | 0.041 ±0.011 |
| R4 | 0.042 ±0.031 | 0.050 ±0.026 | 0.124 ±0.023 | 0.045 ±0.019 | 0.025 ±0.016 |
Attachments
Appendix
Update/changes
28 JUN 2018 Geometry and data uploaded
Notations
ReReynolds number, Re=D⋅u/ν
fgvGuide vane passing frequency (Hz), fgv=n⋅zgv
nRunner rotational speed (revolutions per second)
References
1Trivedi, C. and Dahlhaug, O. G., 2019, Francis-99: A test-case on a high head Francis turbine, Waterpower laboratory, Department of Energy and Process Engineering, Faculty of Engineering, NTNU – Norwegian University of Science and Technology, Trondheim, Norway.
2Trivedi, C., 2018, Investigations of compressible turbulent flow in a high head Francis turbine, Journal of Fluids Engineering, 140(1), p. 011101. https://doi.org/10.1115/1.4037500.
Disclaimer: The provided data, geometry and mesh under Francis-99 workshop series are free for research and education. Upon the usage of the data and the geometry, acknowledgement must be given. “We/I used the test-case provided by NTNU – Norwegian University of Science and Technology under the Francis-99 workshop series.”
Go to top
