Hydrofoil
Test case - Hydrofoil
Test case - Hydrofoil
Test facility
The test facility was developed in the Waterpower laboratory, which consisted of long piping loop and a test-section for the hydrofoil. The aim was to determine the hydrodynamic damping with flow velocity. To measure flow rate (Q) in the test-section, magnetic flowmeter (calibration uncertainty is in the order of 0.1%) was mounted at far downstream of the test-section.
v=Q/A (m s-1)
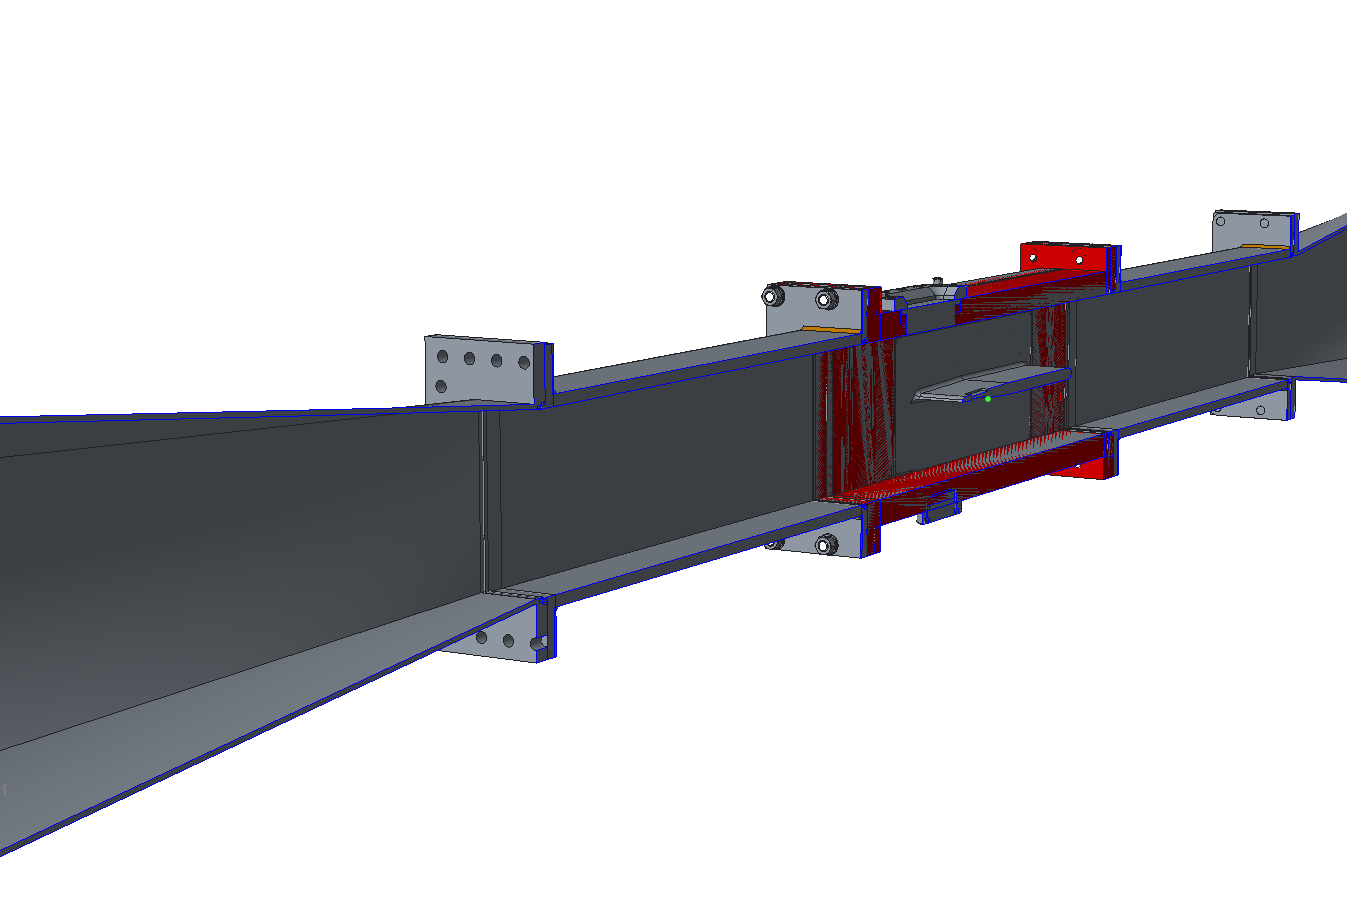
The test rig is comprised of an upstream convergent and downstream diffusor, these change the pipe section from 0.3 m diameter pipe to a square 0.15 m × 0.15 m, measured internally. The test section where the hydrofoil is located along with most of the instrumentation is placed between two straight pipe sections in order to isolate the test section from the effects of the cross section change.

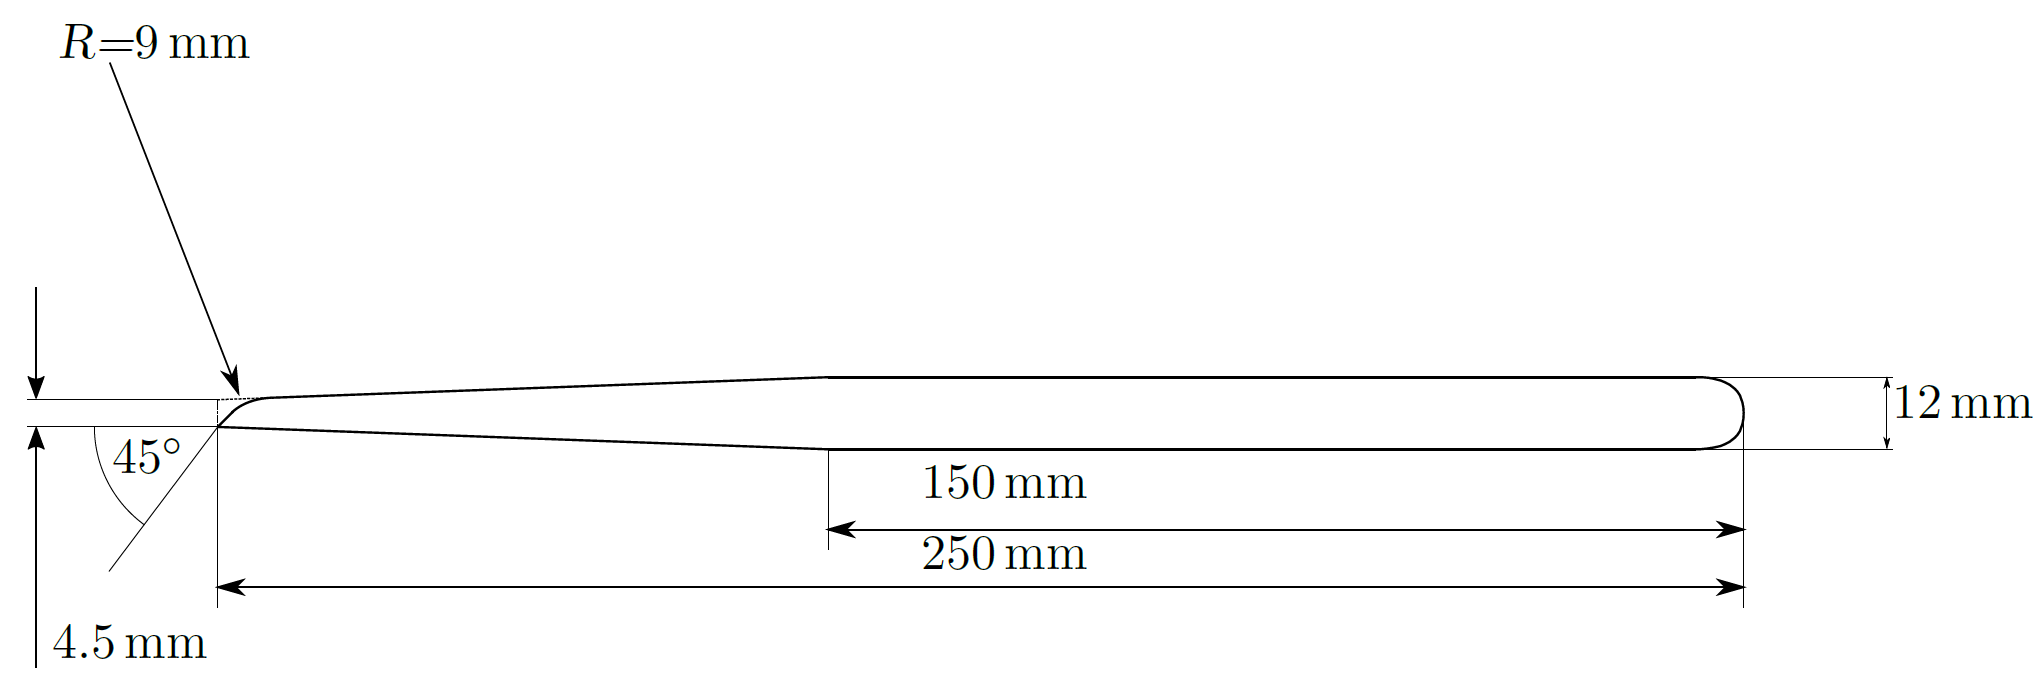
The test section was designed to ensure a sufficient stiffness, in order to provide a grounded support for the test structure, i.e. the hydrofoil, as is good practice for modal testing. This also enables the assumption of stiff walls for boundary conditions when performing structural simulations. The hydrofoil geometry was long and slender, with a thickness of 0.012 m and a cord length of 0.25 m. After 0.15 m from the leading edge, the thickness was tapered down to 4.5 mm at the trailing edge, before being chamfered and rounded on one side, as is normal for runner blades. The hydrofoil was milled from a single piece of aluminum alloy, and grooves were milled for instrumentation and cables. The hydrofoil was mounted without any angle of attack, and was then excited using piezoelectric MFCs actuators from PI Ceramic. Two MFCs were mounted on each side of the foil at the width wise center, close to the trailing edge. By exciting these in a sinusoidal pattern phase-separated by 180°, a bending action is induced in the blade. As the piezoelectric patches are driven by a high voltage signal and is therefore supplied by a E-835 DuraAct Piezo Driver Module.


In order to measure the vibrational amplitude, semiconductor strain gauges from Kulite were mounted on the trailing edge of the hydrofoil, directly downstream the MFCs. In addition to strain gauges, the vibrational amplitude was measured using LDV equipment from Polytech (type OFV 2200 with an optical head of type OFV-303). LDV is a non-intrusive measurement method that measures vibration using the Doppler-shifted reflection of laser light. The LDV measures vibration in a single spot, along the axis of the laser beam, and the measurement point was located at the trailing edge of the foil.


Measurements and data
Measurements and data
The tests were performed using a Stepped-Sine excitation, in which a series of constant-frequency excitations are performed in order to avoid transient effects when moving through a resonant region. Each measurement consisted of around 60 excited frequencies, and each measurement was repeated several times in order to obtain sufficient statistics for an assessment the uncertainty in both damping and natural frequency. The tests were performed with water velocity 0–25 m s-1, with steps of 5 m s-1. The test rig was pressurized in order to obtain cavitation-free conditions.
Interpretation of the hydrofoil data
The hydrofoil data is presented as a set of files, with some information at the heading of each. A more detailed explanation on interpreting the data is given here.
File overview: Three types of data files are given.
- Francis-99.txt: This file contains the main results from the hydrofoil experiments. The results consist of discharge, damping factor, natural frequency, and gauge pressure in the test rig inlet section.
- FRF_[X]ms.txt: There are seven of these files, each representing measurements at a separate discharge. The filename denotes the bulk velocity in the test section, and discharge is provided in each file. Other than that, the files give data for frequencies tested, along with amplification factor and phase delay. The amplification factor is normalized to unit value (=1) at resonance.
- noExcitation.txt: This file contains the hydrofoil’s response without MFC excitation, for different discharges. The response is expressed in trailing edge deflection amplitude, as well as frequency of vibration.
Francis-99.text: Most of the parameters presented in this file are self-explanatory. Each line of data is made from a set of 30 repetitions at that discharge. The damping factor is commonly written as zeta, with 0 being undamped, 1 being critical damping, and anything above 1 overdamped. Critical damping is the point at which oscillations will not occur for a step excitation.
FRF_[X]ms.txt: Each of these files contain the frequency response function, made from 30 repetitions. The frequency response is made from three parameters: frequency, amplification and phase delay. These can be used to construct bode plots (frequency vs amplitude, frequency vs. phase), or to construct nyquist plots (real vs. imaginary). The damping and natural frequency can be extracted from the shape of the curve, and the absolute values are therefore not relevant. As such, the amplitude has been normalized to the value at resonance, and is referred to in the file as “Relative Amplitude Response”
noExcitation.txt: This file contains measurements of trailing edge movement for different discharges, without the MFC excitation. This is therefore a good indication of the vortex shedding interaction. The data shows the maximum amplitude with a corresponding frequency of vibration, for different discharges.
Two distinct geometries of hydrofoil are given: (1) with fillet and (2) without fillet. The geometry without the fillet may be used for the CFD analysis and the geometry with the fillet can be considered for the FSI analysis. The geometry is provided in four different format types, i.e., *.iges, *.parasolid, *.stl, and *.step. We believe that these format types are enough to work with different software to create mesh and conduct the simulations.
Data
Appendix
Update/changes
18 JUN 2018 Geometry and data uploaded
Notations
LDVLaser Doppler vibrometer
MFCMacrofiber composite
ReReynolds number
ACross-sectional area of test-section (m2), (0.15 m × 0.15 m)
QFlow rate (m3 s-1)
v, wFlow velocity (m s-1)
ζHydrodynamic damping1
ωnNatural frequency of hydrofoil (Hz)1
References
1Bergan, C. W., Solemslie, B. W., Ostby, P., and Dahlhaug, O. G., 2018, "Hydrodynamic damping of a fluttering hydrofoil in high-speed flows," International Journal of Fluid Machinery and Systems, 11(2), pp. 146-153. http://dx.doi.org/10.5293/IJFMS.2018.11.2.146.
Disclaimer: The provided data, geometry and mesh under Francis-99 workshop series are free for research and education. Upon the usage of the data and the geometry, acknowledgement must be given. “We/I used the test-case provided by NTNU – Norwegian University of Science and Technology under the Francis-99 workshop series.”
Go to top
 Hydrofoil measurement data