
Experimental study
Test case
EXPERIMENTAL STUDY
Experiments were performed on a model Francis turbine considering open loop hydraulic system. Operating head was approximately 12m and the discharge was 0.2 m3 s-1 the BEP. Two logging systems were used to acquire data from the turbine. One logging system was used to acquire data related to the hill diagram and another was used to acquire pressure values from the additional pressure sensors. Total six pressure sensors were mounted in the turbine, one sensor (VL01) was located at the vaneless space, three sensors (P42, S51 and P71) were located in the runner, and two sensors (DT11 and DT21) were located in the draft tube cone. Locations of the sensors and logging system are shown in Figure 1. The pressure values were acquired at the sampling rate of 2083 Hz. A wireless telemetry system was used to acquire data from the runner sensors. Click here [2] for detailed information about the measurements.
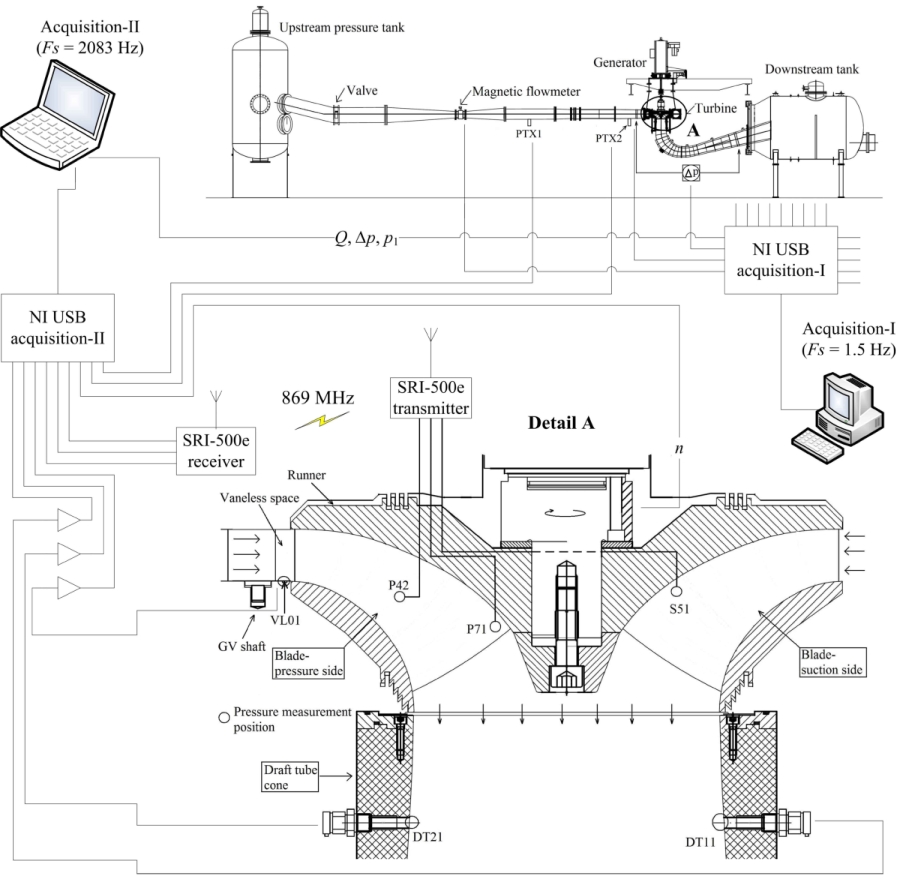 Figure 1 Francis test rig and sensor locations
Calibration uncertainties
IEC 60193 was followed for the calibration, measurements, and computations of the data. Uncertainties in the discharge, inlet pressure, and differential pressure measurements were ±0.1%, ±0.05%, and ±0.018%, respectively. The uncertainties in the generator input torque measurement, friction torque measurement, and runner angular speed measurement were ±0.034%, ±0.052, and ±0.05%, respectively. Total uncertainty in hydraulic efficiency was ±0.16%.
Results
Performance study
Before the pressure and velocity measurements, detailed analysis of the turbine performance was carried out. Total 10 different angle of guide vane were selected and 15 different speed values for each angle of the guide vane were selected. Thus, efficiency measurements were conducted at total 150 points. The constant efficiency hill chart was prepared. The maximum efficiency of 93.4% was observed at nED=0.18 and QED=0.2. Guide vane angles 3.9 degree and 14 degree correspond to minimum and the maximum loads of the turbine, respectively. For the first workshop three operating point were considered: (1) For PL, nED=0.215 and QED=0.07, (2) For BEP, nED=0.18 and QED=0.2, (3) For HL, nED=0.195 and QED=0.19. Table 1 shows the observed parameters at these operating points. These parameters should be used for the numerical studies and its validation. Cross sectional areas at the turbine inlet and outlet pressure measurement sections are 0.0872 m2 and 0.2360 m2, respectively. The Gravitational constant at the laboratory location is 9.821 m s-2. The reference diameter of the model Francis runner is 0.349 m. The kinematic viscosity is 9.57E-7 m2 s-1. The Reynolds numbers at BEP are 1.8E6.
 Figure 2 Constant Efficiency Hill Diagram
| Parameter | PL | BEP | HL | Remark |
|---|---|---|---|---|
| Turbine inlet pressure absolute (kPa) | 219.93 | 216.54 | 210.01 | Pressure was measured just before the casing inlet using ring type manifold. |
| Differential pressure across the turbine (kPa) | 120.39 | 114.98 | 114.03 | Turbine outlet pressure = Inlet pressure - Differential pressure. |
| Water density (kg m-3) | 999.23 | 999.19 | 999.20 | Water density was computed using measured temperature value. |
| Net head (m) | 12.29 | 11.91 | 11.24 | Head was calculated using equations given in IEC 60193. |
| Discharge (m3 s-1) | 0.071 | 0.203 | 0.221 | Discharge was measured using a magnetic flow meter. |
| Generator input torque (Nm) | 137.52 | 619.56 | 597.99 | Torque was measured in-between the thrust block just and generator. |
| Friction torque (Nm) | 6.54 | 8.85 | 7.63 | Torque developed by runner = Generator input torque + Friction torque. |
| Runner speed (rpm) | 406.2 | 335.4 | 369.6 | |
| Hydraulic efficiency (%) | 71.69 | 92.61 | 90.66 | Hydaulic efficiency is computed using equations given in IEC 60193 |
| Guide vane angle (degree) | 3.91 | 9.84 | 12.44 | 14 degree is the maximum opening position (full load). |
Pressure measurement
Unsteady pressure measurements were carried out at six different locations as shown in Figure 1. The same operating points were selected for the pressure measurements. The pressure values were acquired at a sampling rate of 2083 Hz. The pressure values might include frequencies related to electrical power, 50 Hz and its harmonic. The pressure sensors and data acquisition system were powered by grid supply. However, this can be filtered out by using available standard filters. The maximum uncertainties of VL01, P42, S51, P71, DT11, and DT21 sensors are ±0.15%, ±0.62%, ±0.22%, ±0.45%, ±0.15, and ±0.15% of the measured value, respectively [2].
| Sensor | VL01 | DT11 | DT21 | P42 | P71 | S51 |
|---|---|---|---|---|---|---|
| x (m) | 0.2623 | -0.0904 | 0.0904 | 7.16E-5 | -0.0666 | -0.0800 |
| y (m) | 0.1935 | 0.1566 | -0.1566 | 0.1794 | 0.0423 | 0.0838 |
| z (m) | -0.0296 | -0.3058 | -0.3058 | -0.0529 | -0.0860 | -0.0509 |
Velocity measurement
LDA and 2D PIV were used for the velocity measurement in the draft tube cone. LDA is composed of a Spectra-Physics Model 177G, equipped with a Burst Spectrum Analyzer (BSA) from Dantec Dynamics. The LDV probe was mounted on a traverse table with the probe perpendicular to the glass wall of the index-matching box. The perpendicularity was checked with optical methods with an accuracy of 0.2 degree. The front lens had a focal length of 310 mm. The seeding particles of Expancel 46 WU 20 with an average diameter of six µm were used. The L1 and L2 sections are at the distance of 0.064 and 0.382 m from the runner outlet, respectively. For the 2D PIV system, pulse light sheets with a thickness of about 3 mm were generated by a Litron Laser NANO L100-50PIV. The illuminated field was recorded by a four megapixel camera (VC-4MC-M180). TSI seeding particles, with a density of 1.016 g/cc, refractive index of 1.52 and mean diameter of 55 µm was used during the measurements. The PIV measurement data were sampled at the rate of 40 Hz. About 750 paired images with a time difference of 200 µs were recorded at each measurement section.
| Parameter | PL | BEP | HL |
|---|---|---|---|
| Net head (m) | 12.29 | 12.77 | 12.61 |
| Discharge (m3 s-1) | 0.07 | 0.21 | 0.23 |
| Runner speed (rpm) | 406.2 | 344.4 | 380.4 |
| nED (-) | 0.22 | 0.18 | 0.20 |
| QED (-) | 0.22 | 0.18 | 0.20 |
| Hydraulic efficiency (%) | 72.5 | 92.4 | 91 |
Velocity measurements (axial and tangential) were performed with LDA along two horizontal lines in the draft tube. The two lines L1 and L2 are located 64 mm and 382 mm below the draft tube inlet, respectively.
| Location | Line 1 (L1) | Line 2 (L2) | ||
|---|---|---|---|---|
| Starting point | End pint | Starting point | End pint | |
| x (m) | 0 | -0.1789 | 0 | -0.1965 |
| y (m) | 0 | 0 | 0 | 0 |
| z (m) | -0.2434 | -0.2434 | -0.5614 | -0.5614 |
The velocity data is available In the following file for the three operating points investigated: PL, BEP and HL. Positive axial velocity is defined in the stream-wise direction and the tangential velocity is positive in the runner rotational direction. However, vibration were induced in the test rig at the BEP and HL, Which interfered with the measurements at These conditions.
 LDA measurement velocity profiles
[2] Trivedi, C., Cervantes, M., Gandhi, B., and Dahlhaug, O. G., 2013, "Experimental and numerical studies for a high head Francis turbine at several operating points," J Fluid Eng-T Asme, 135(11), pp. 1111021-17. http://dx.doi.org/10.1115/1.4024805.
Disclaimer: The provided data, geometry and mesh under Francis-99 workshop series are free for research and education. Upon the usage of the data and the geometry, acknowledgement must be given. “We/I used the test-case provided by NTNU – Norwegian University of Science and Technology under the Francis-99 workshop series.”